 INCISOR®
Now its own app.
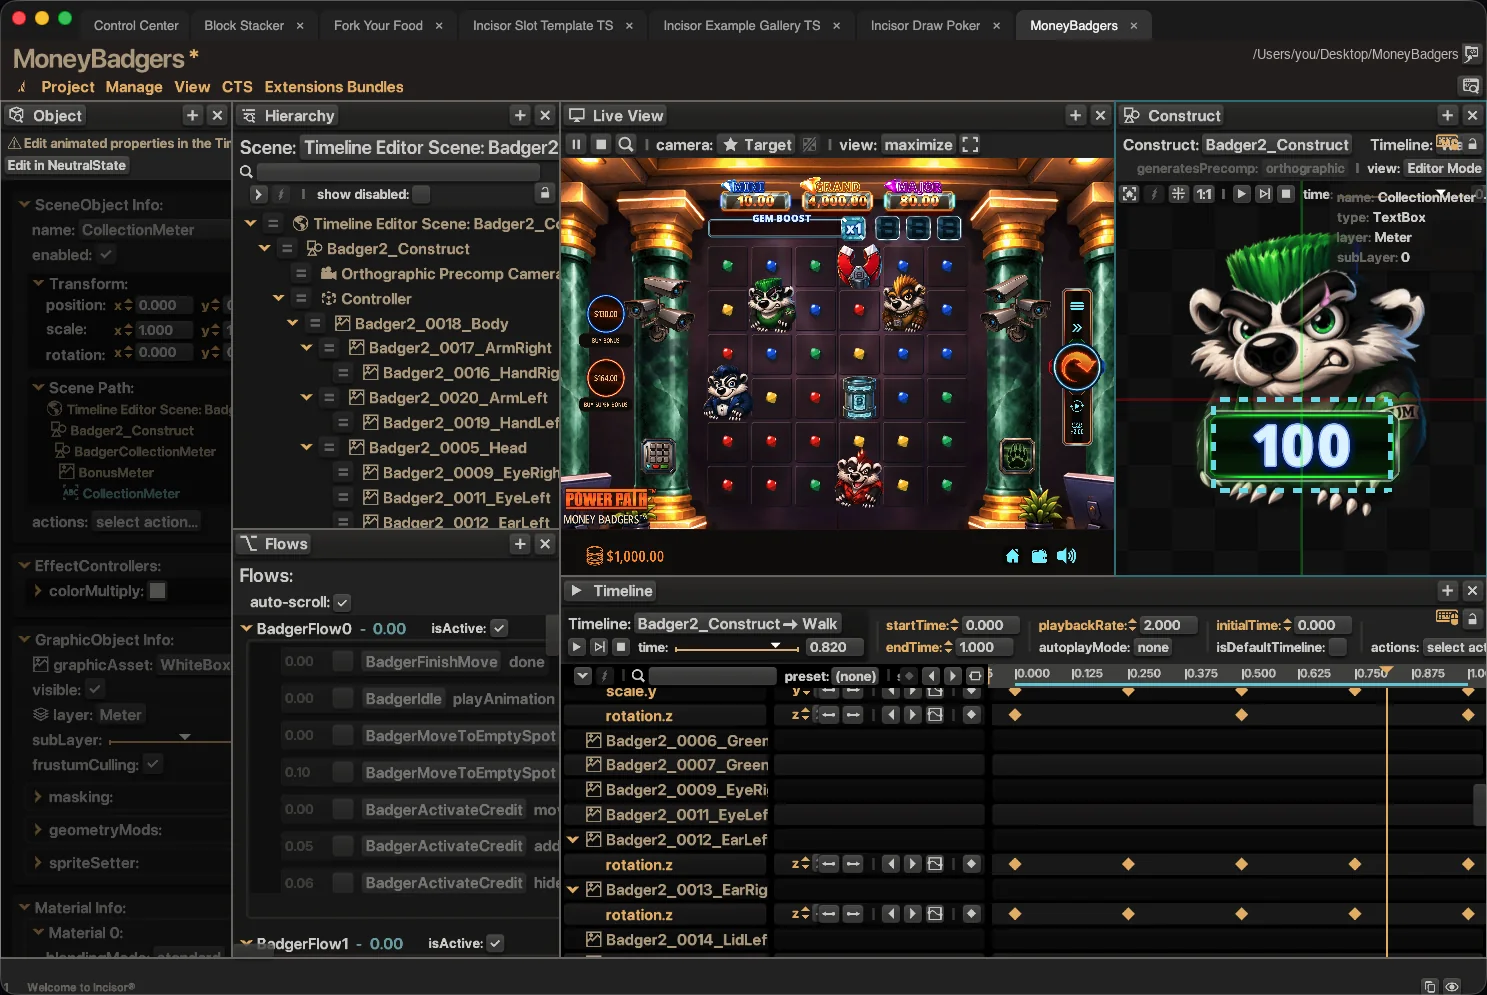
Incisor® runs in its own window. Every project is a tab in that window, not a browser tab. It stays stable through sleep and wake, and it remembers the window size and position you left it in.
Tabs, one window
Open as many projects as you like. Each one is a tab in the Incisor® window, with its own inspector and Live View.
A Control Center to come home to
Every window opens on the Control Center: the Project Gallery, your recent projects, and the Browse and New Project buttons, one tab to the left of your work.
Never loses the thread
Sleep it, wake it, switch Wi-Fi, come back a day later. Incisor® stays connected to every open project.
TypeScript, built in
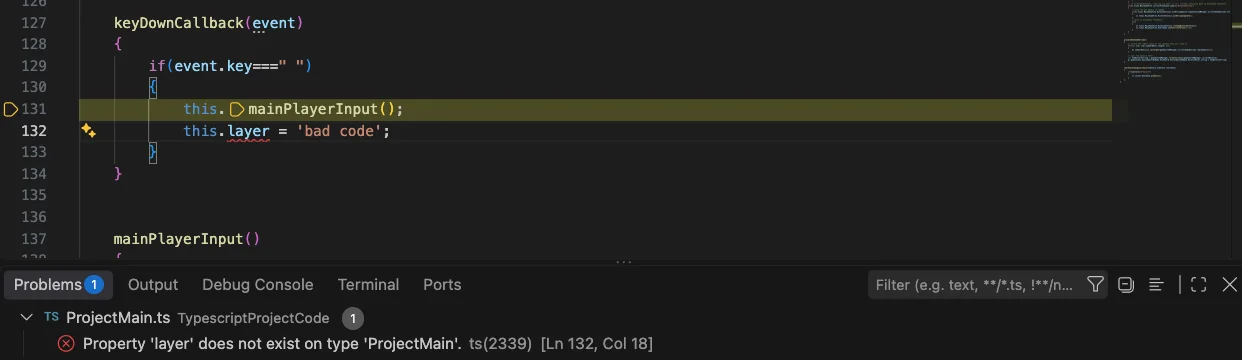
Tick usingTypescript and write TypeScript. No Node, no npm, no package.json. Incisor® compiles it, type-checks it automatically, and surfaces the errors in VS Code's Problems panel and in its own log.

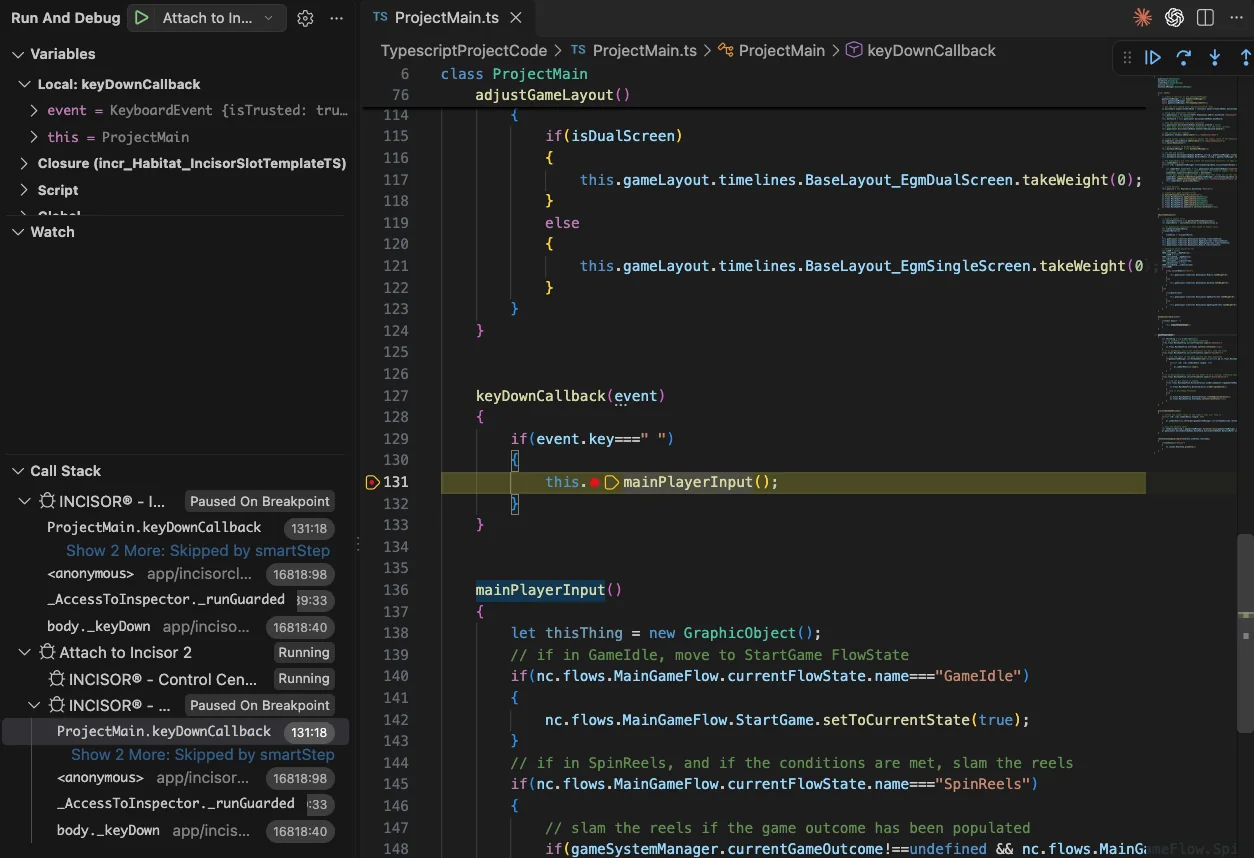
Errors point to source. Breakpoints too.
Source maps mean you debug the code you wrote, not the bundled code that was generated. Every error links to your original file, TypeScript or JavaScript, and one click opens that line in the dev tools. Want more? Set breakpoints in VS Code and step through your own code while the project runs in Incisor®.
- Incisor® sets up VS Code for you, and leaves your existing setup alone.
- Source maps mean you debug the code you wrote, not the code that was generated.
Desktop publishing, simplified
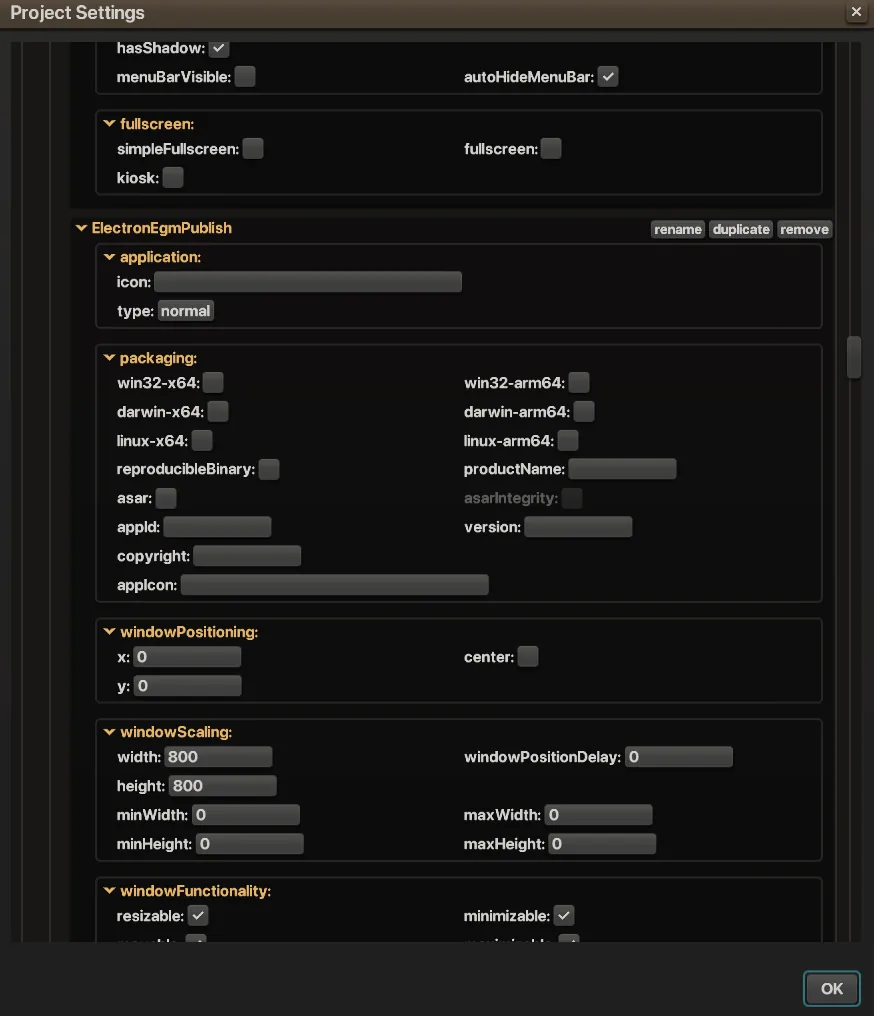
Publishing a desktop app is a project setting and a button. No Node, no npm, no electron-builder.
- Mac apps are signed automatically.
- One icon setting covers Mac and Windows.
- Optional packaging that blocks tampering with the published files.
- Reproducible builds: the same project gives the same binary every time.
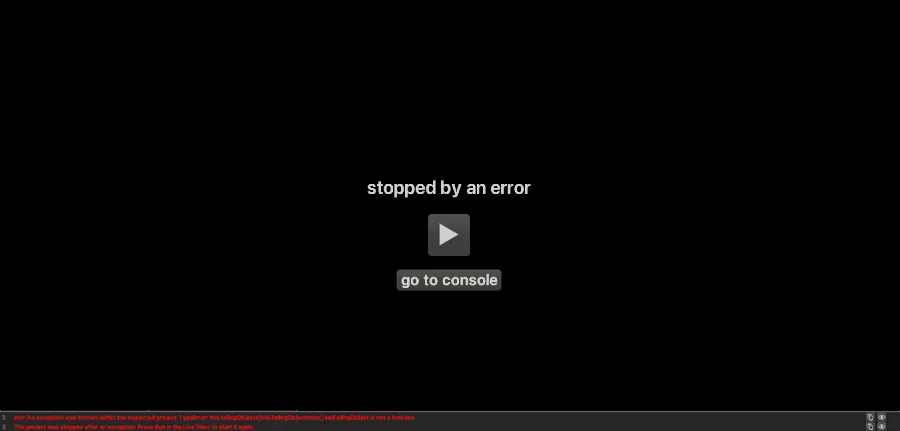
Run and Stop
Projects open paused, so an error in the project can't take the editor down with it. When an error does hit, the project stops on the spot and the log takes you to the cause.
- Press Run when you're ready, or turn on
runProjectOnOpen. - Save your code while the project is running and it keeps its state.
- go to console opens the error with a link to the line that threw it.
Play the proof.
The Project Gallery is built into Incisor®. Open a project, play it, then open its code and see how it was made. Several were built under one rule: take one week and make what you want.
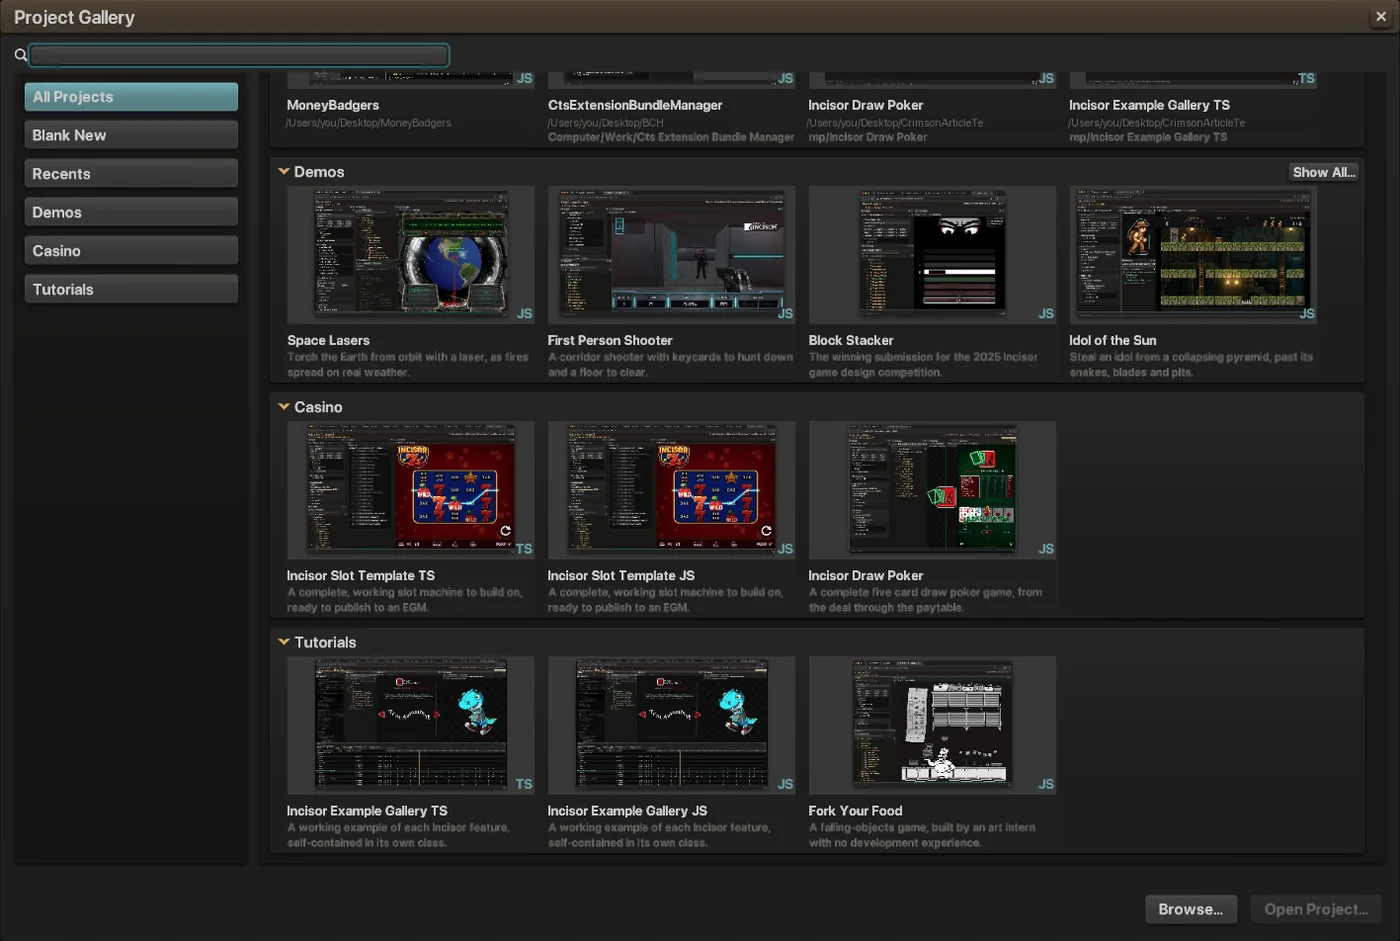
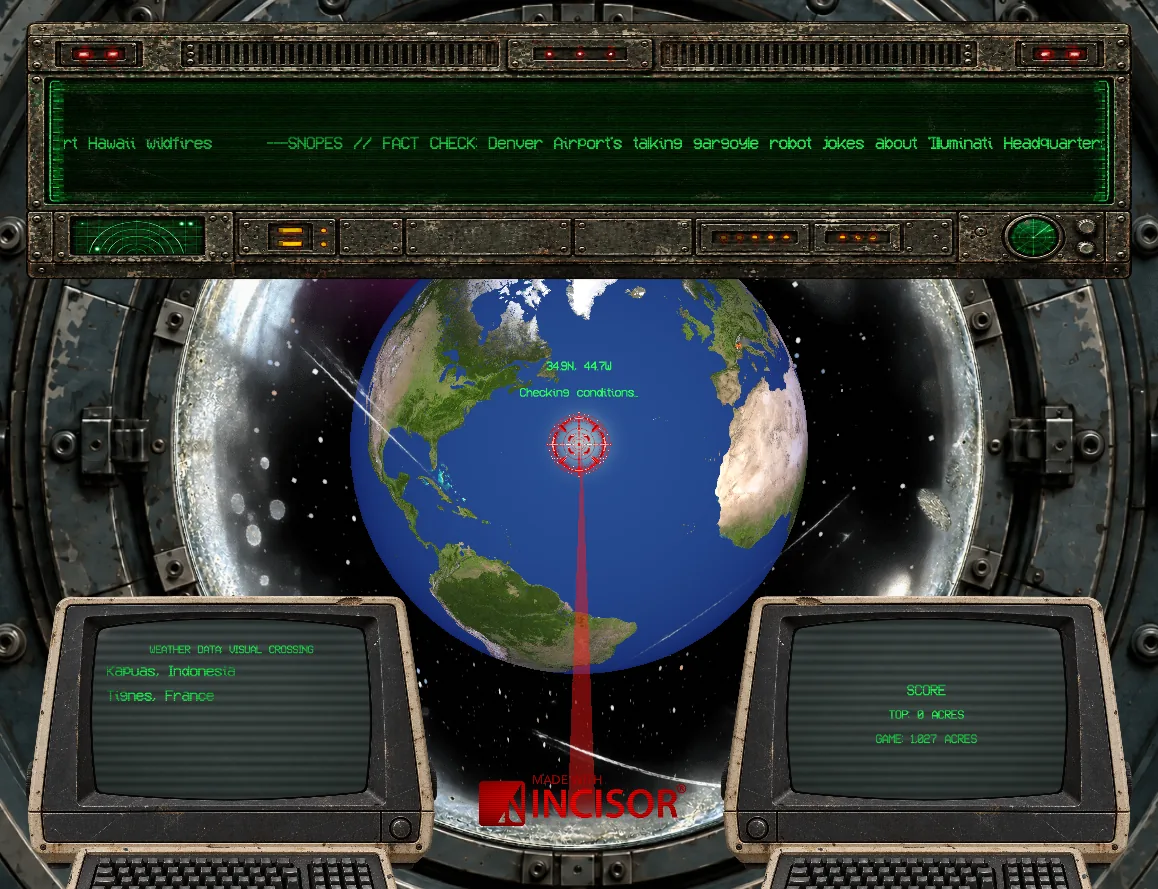
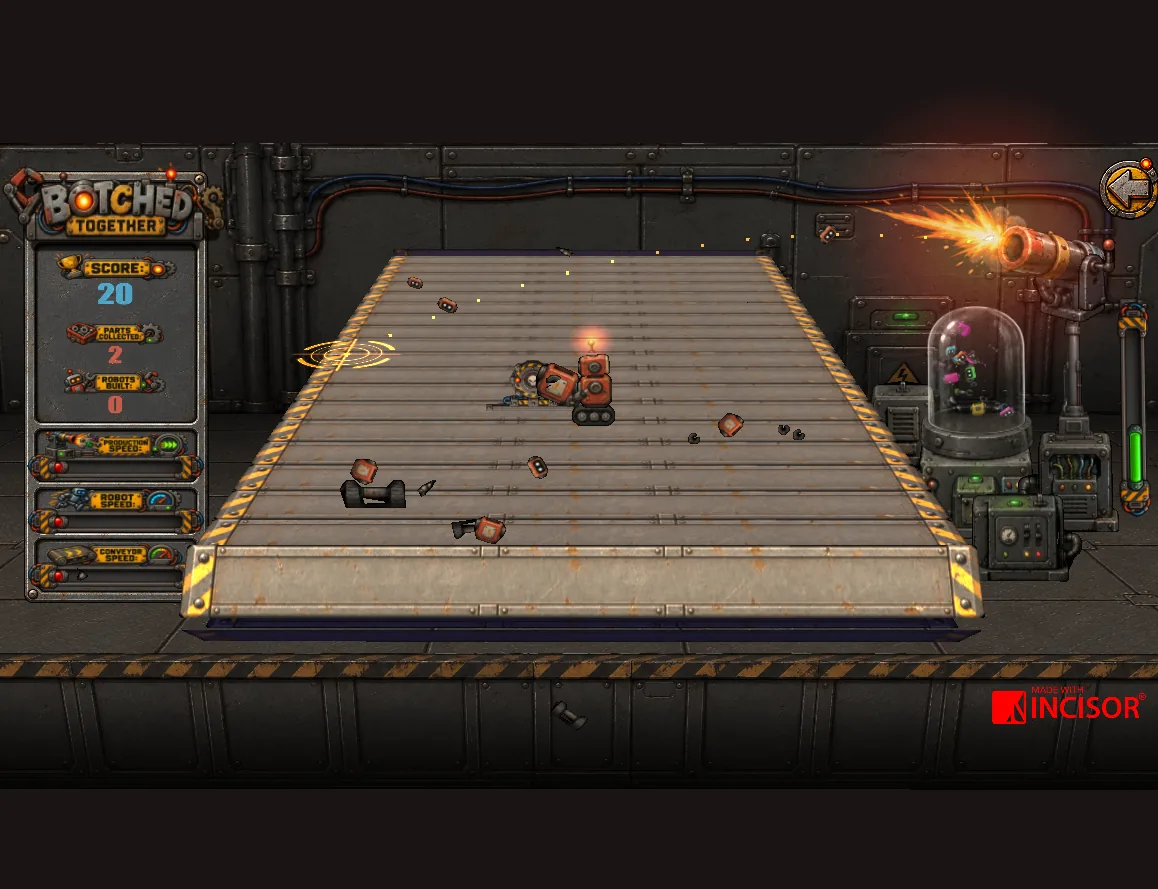
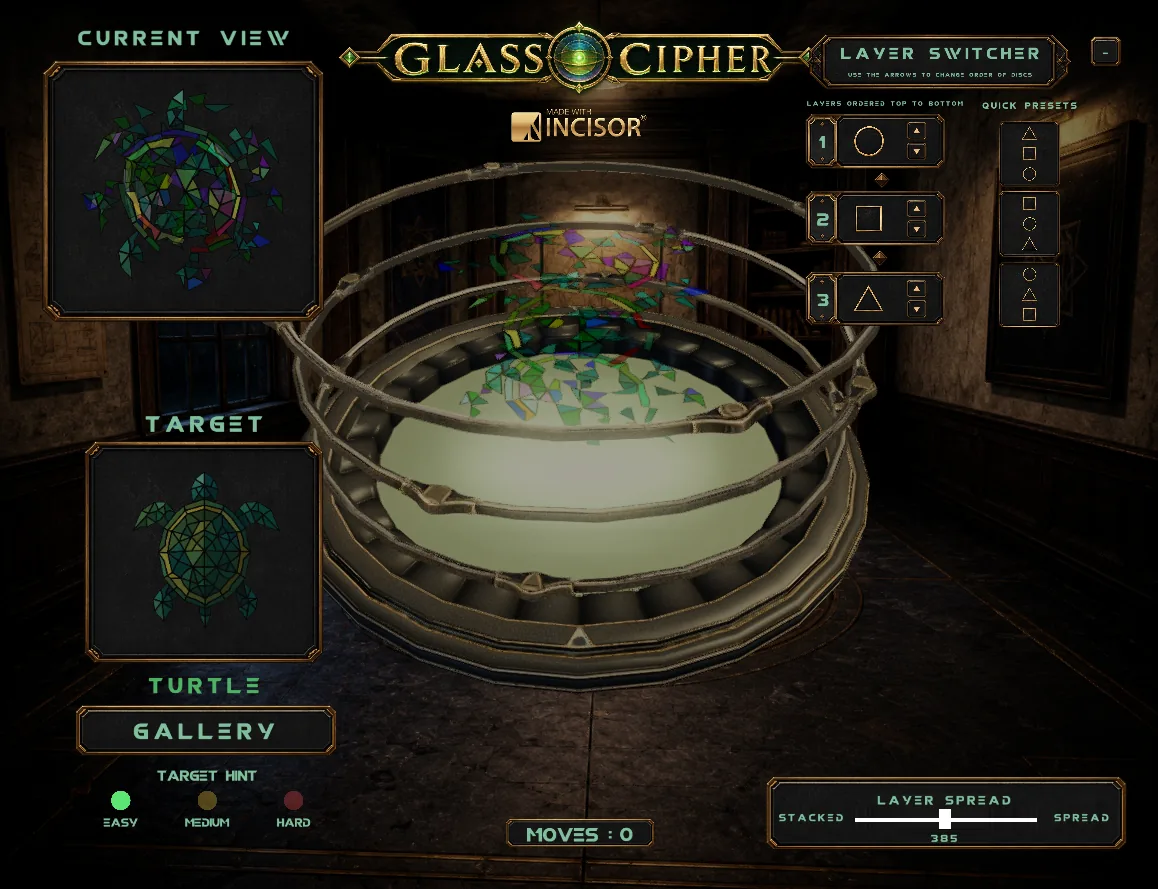
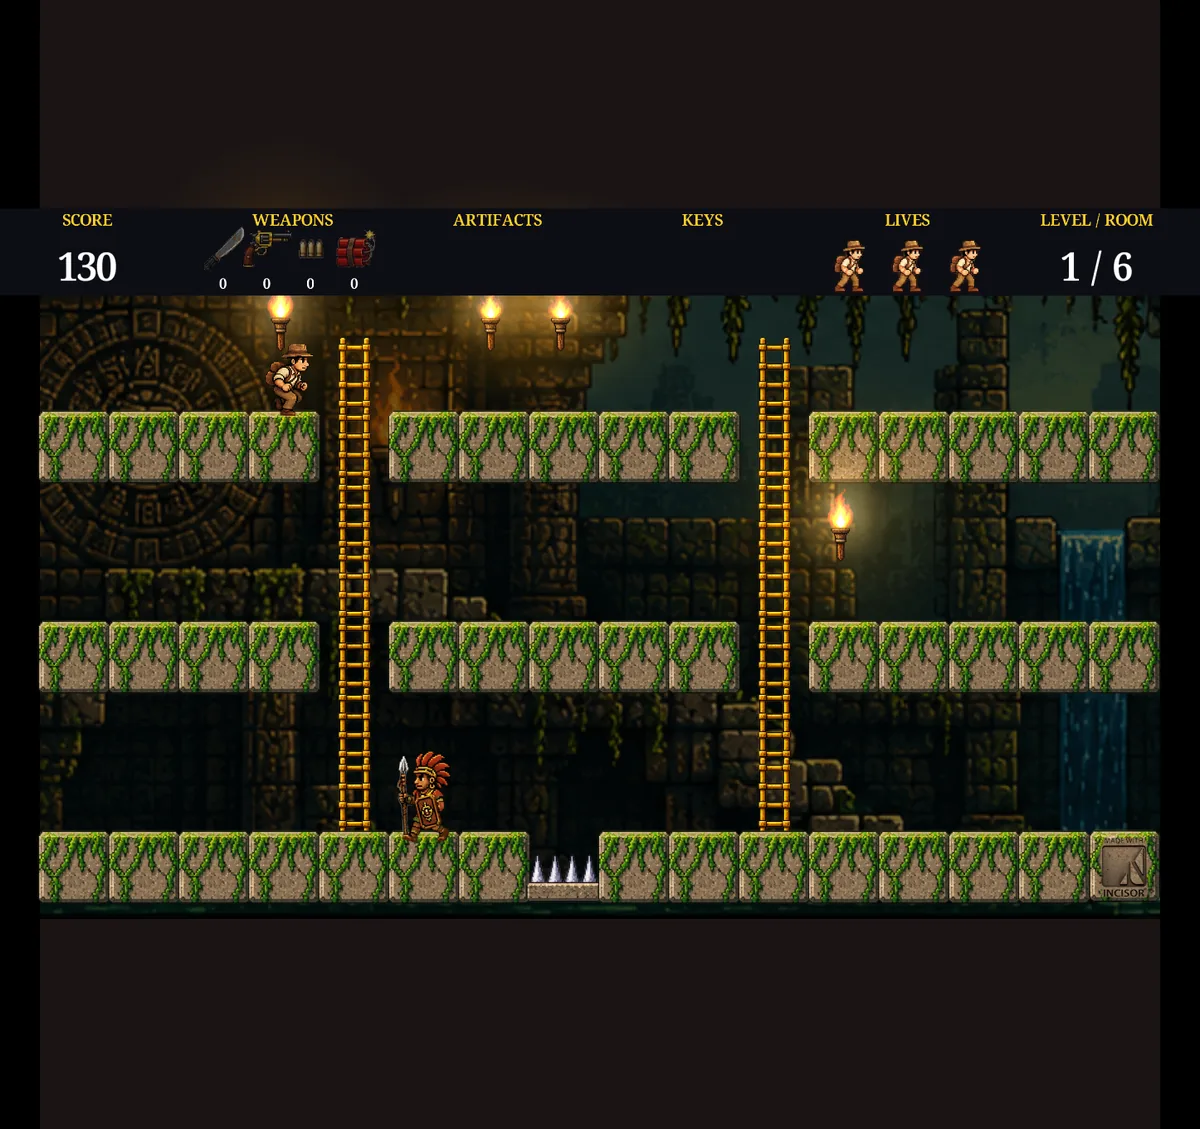
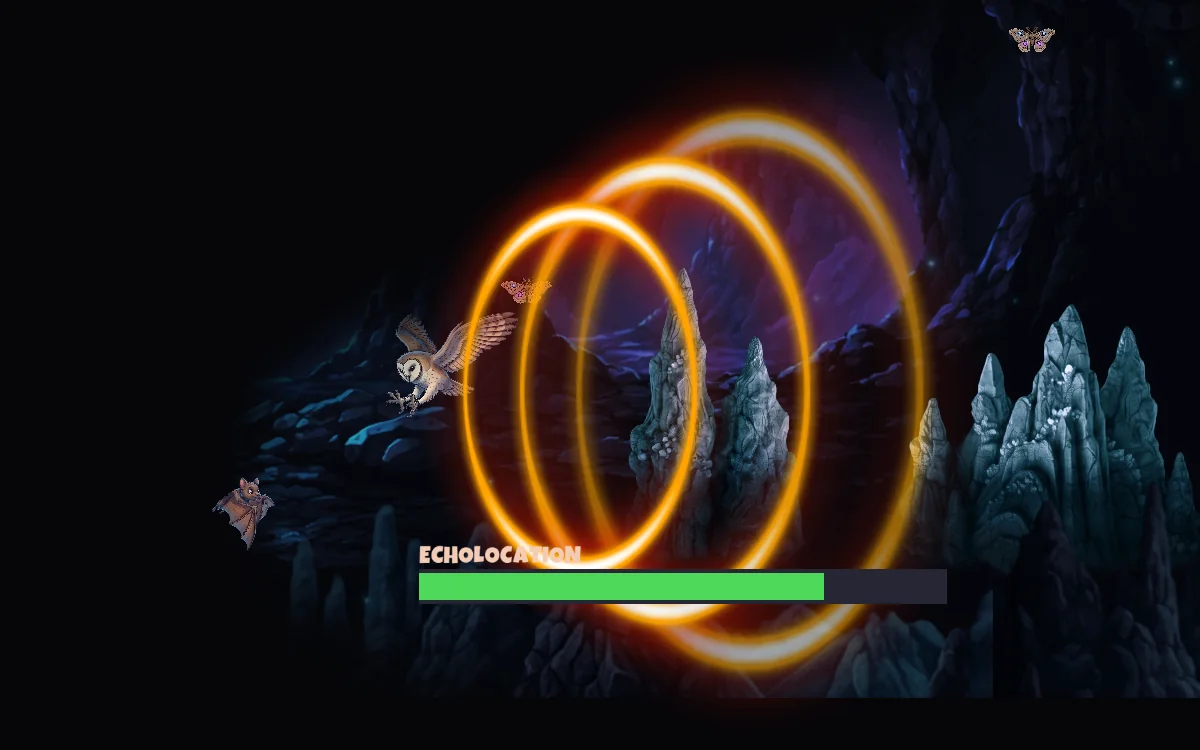
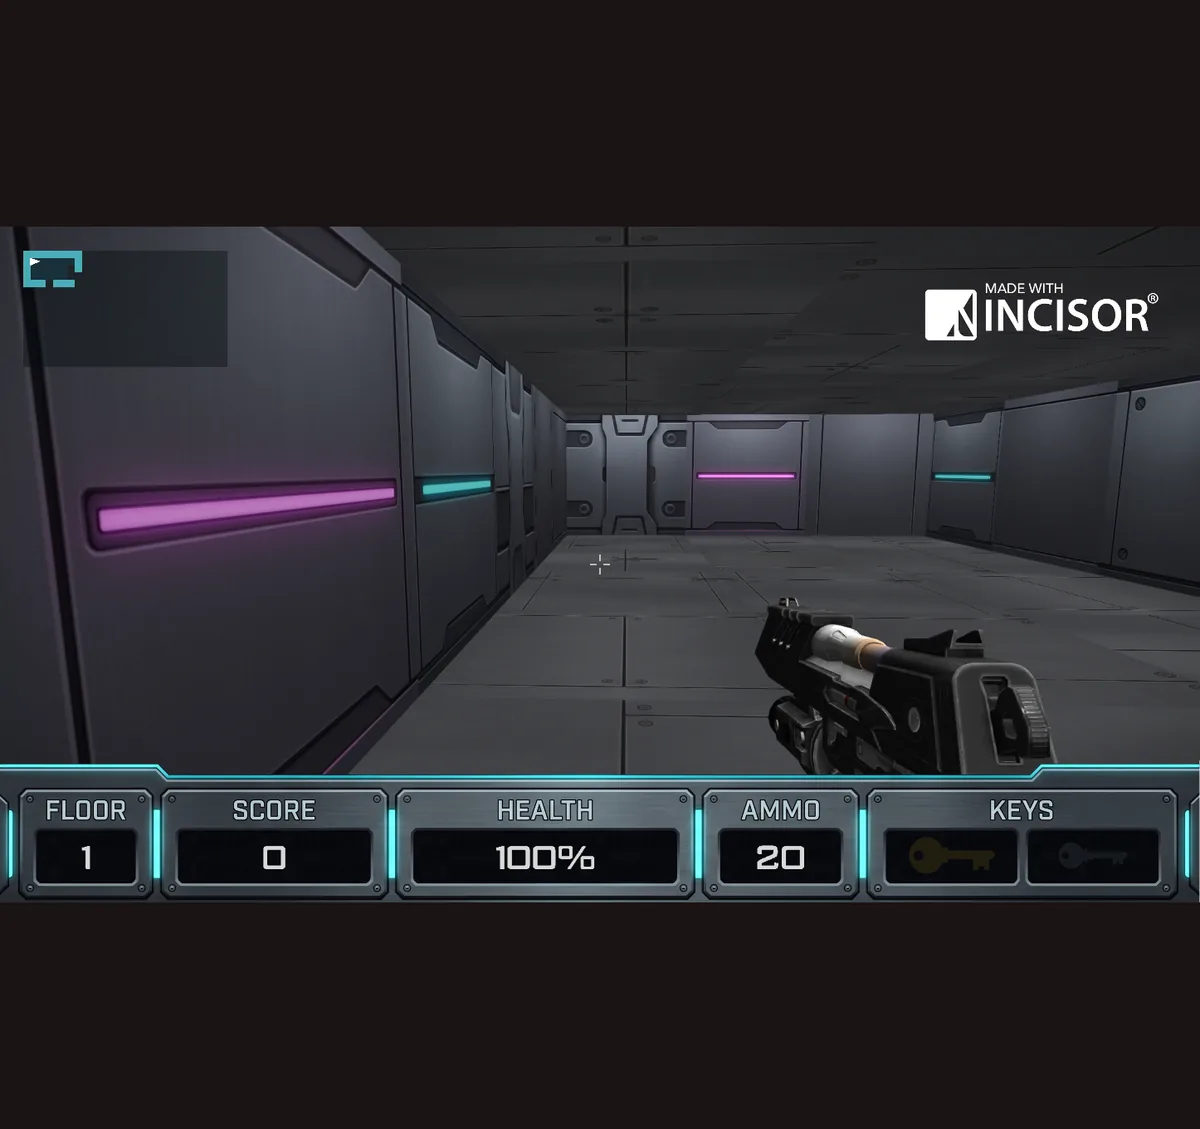
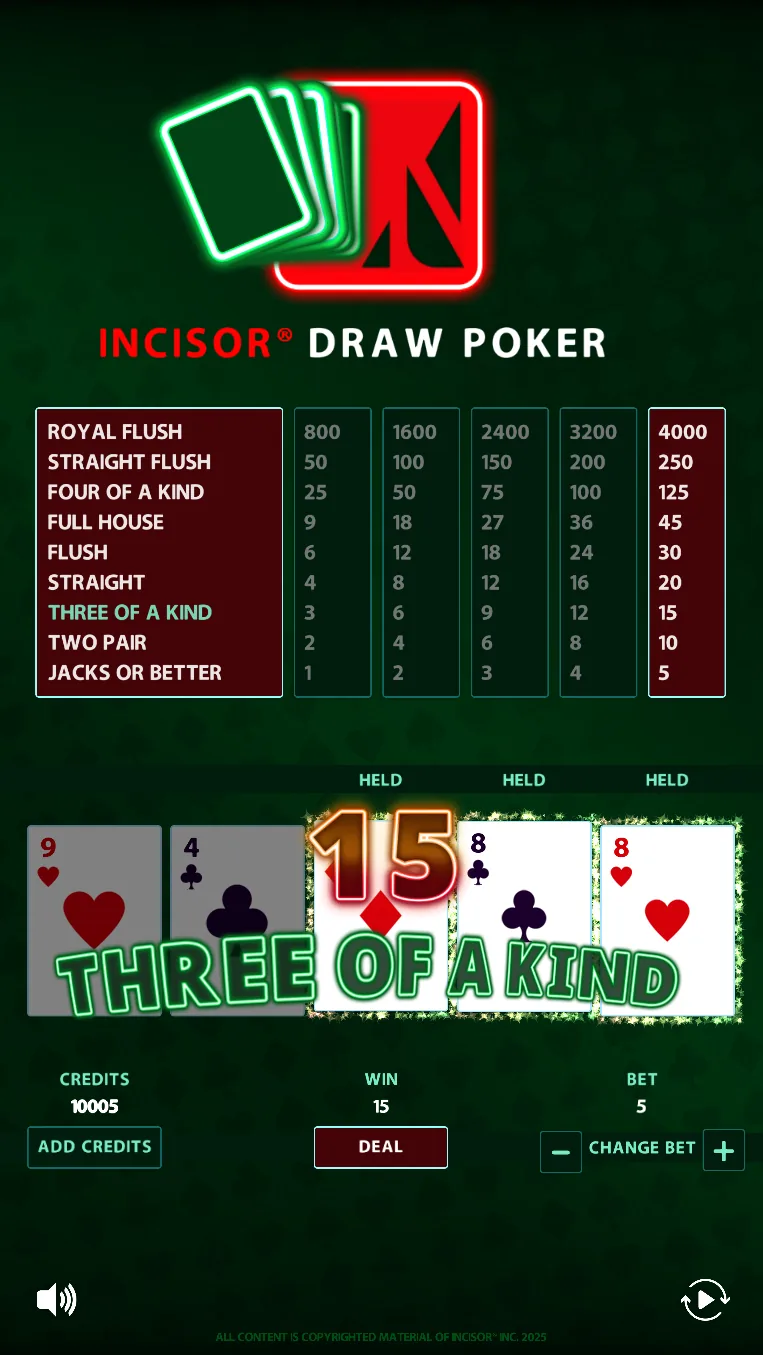
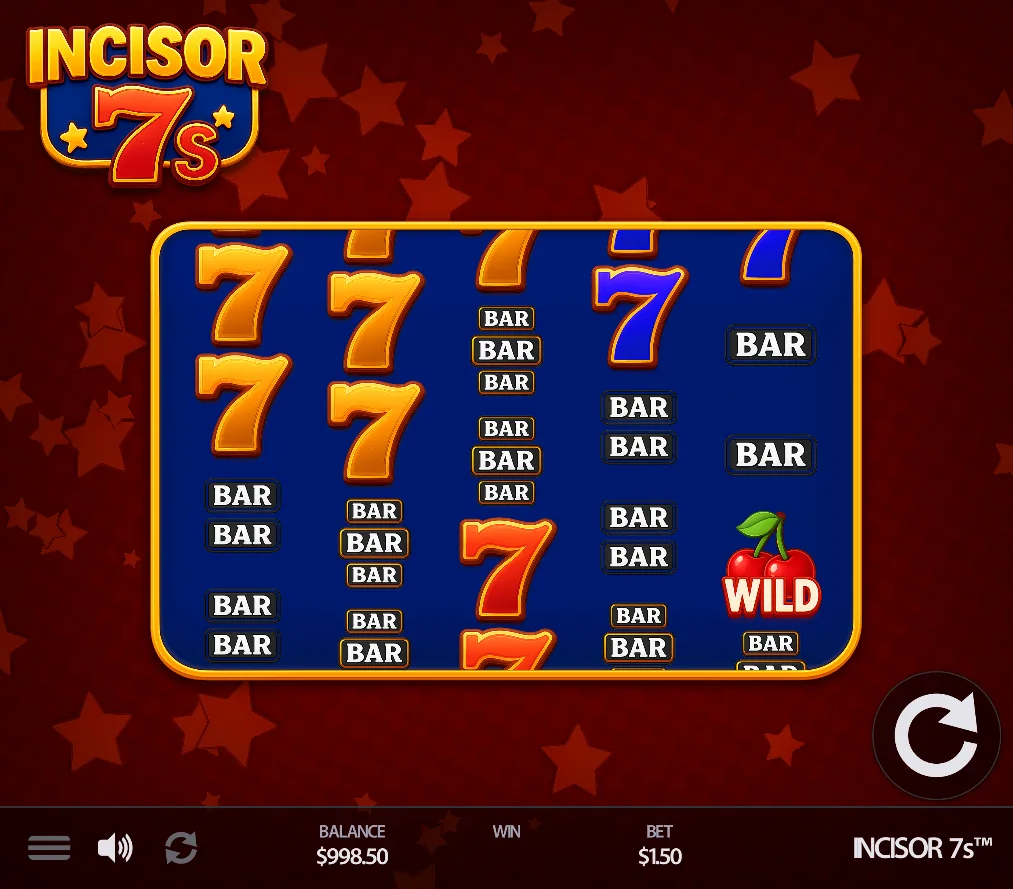
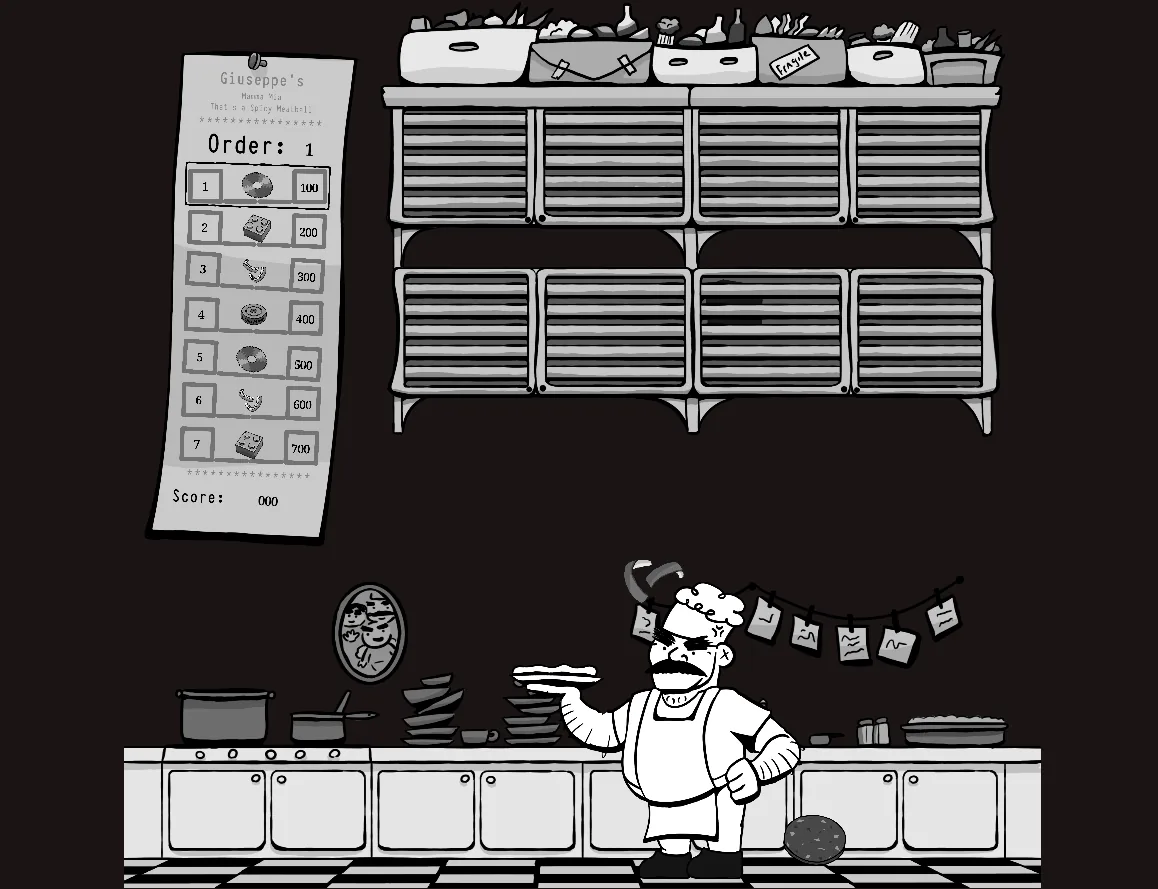
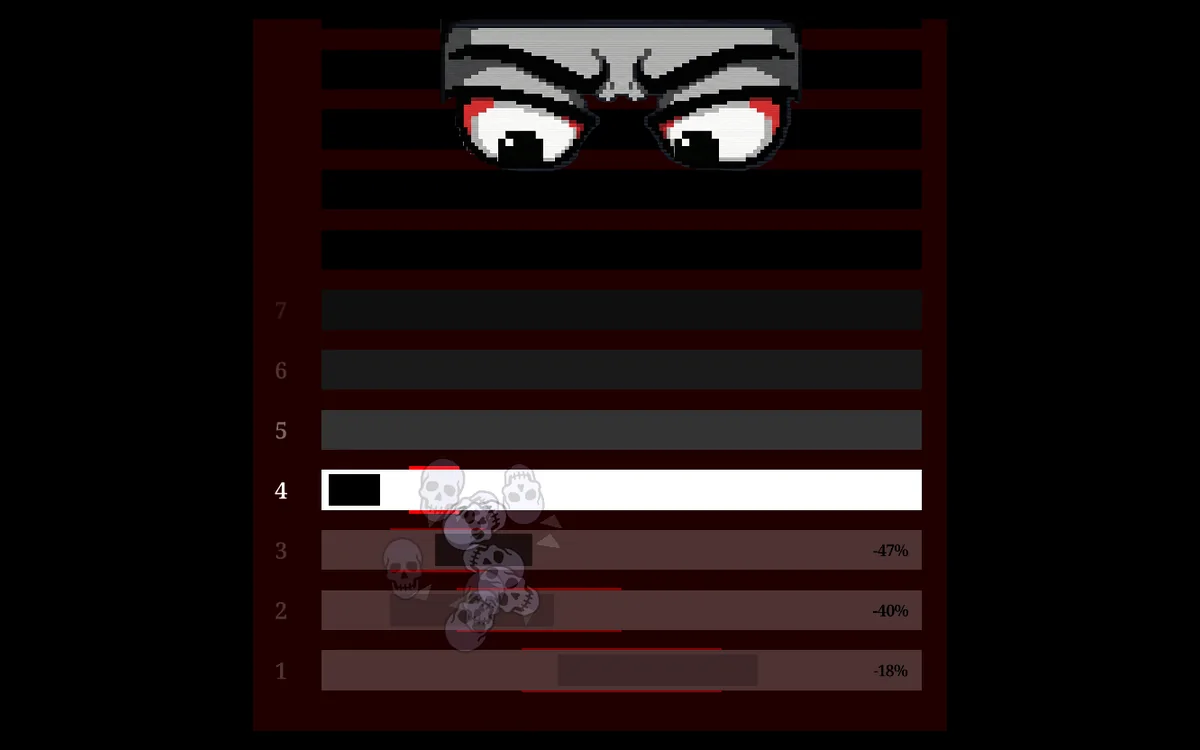
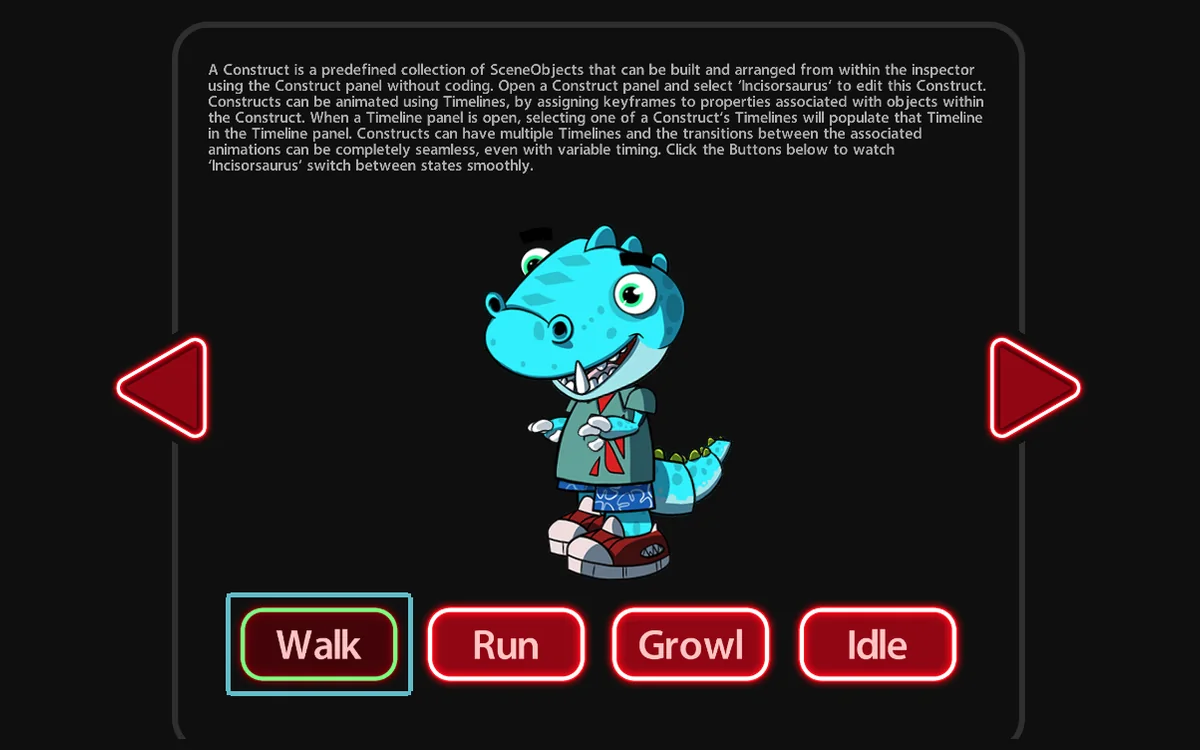
Alongside the games are the blank 2D and 3D starters, the Slot Template in JavaScript and TypeScript, and the Example Gallery that demonstrates one API feature at a time. Several of the demo projects were written with an AI assistant working from the Incisor® knowledge base, which is how a corridor shooter and a glass puzzle both fit in a week.
An editor for the whole team.
Crimson rebuilt the inspector around one idea: the people who make the art, the sound and the animation should be able to put it in the game themselves. Every panel below is something a non-coder can drive.
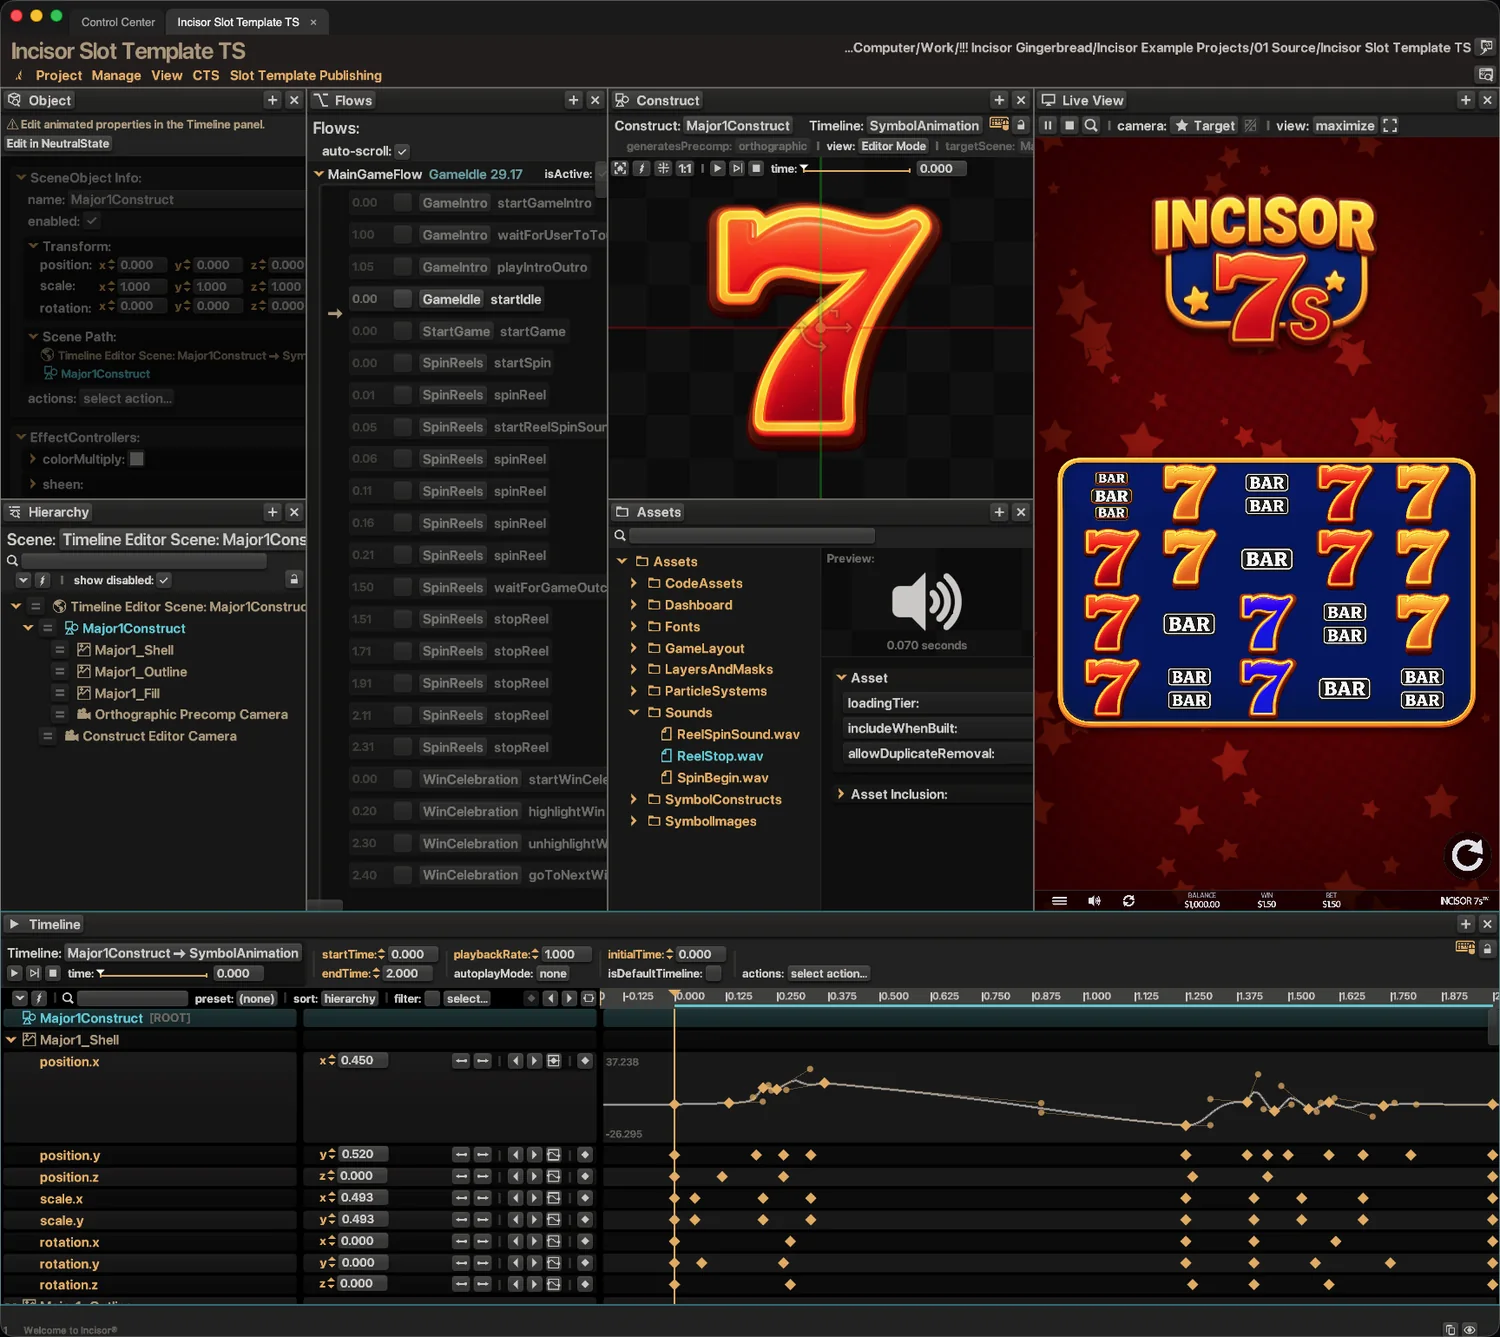
Every control, upgraded
The GUI components behind every panel were rebuilt. Lists are searchable. Select five objects and the Object panel supervises all of them at once, showing where they agree and where they differ. Previews are visual, and the small things, from drag handles to keyboard navigation, have been enhanced across the board.
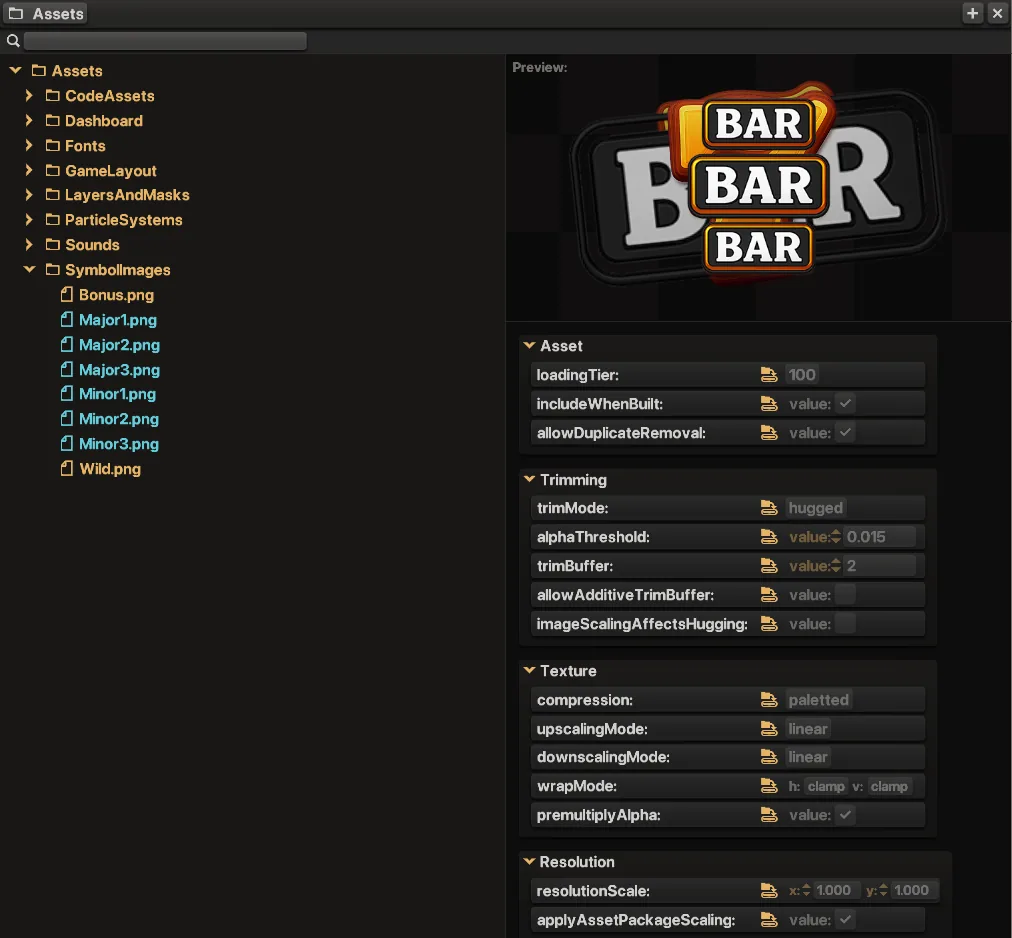
The Assets panel, overhauled
Click an asset and see it. Shift-click a run of them and change their settings together. Trimming, texture, resolution, sprite sheet and shapify options sit in one condensed list instead of a scroll.
What those settings do for performance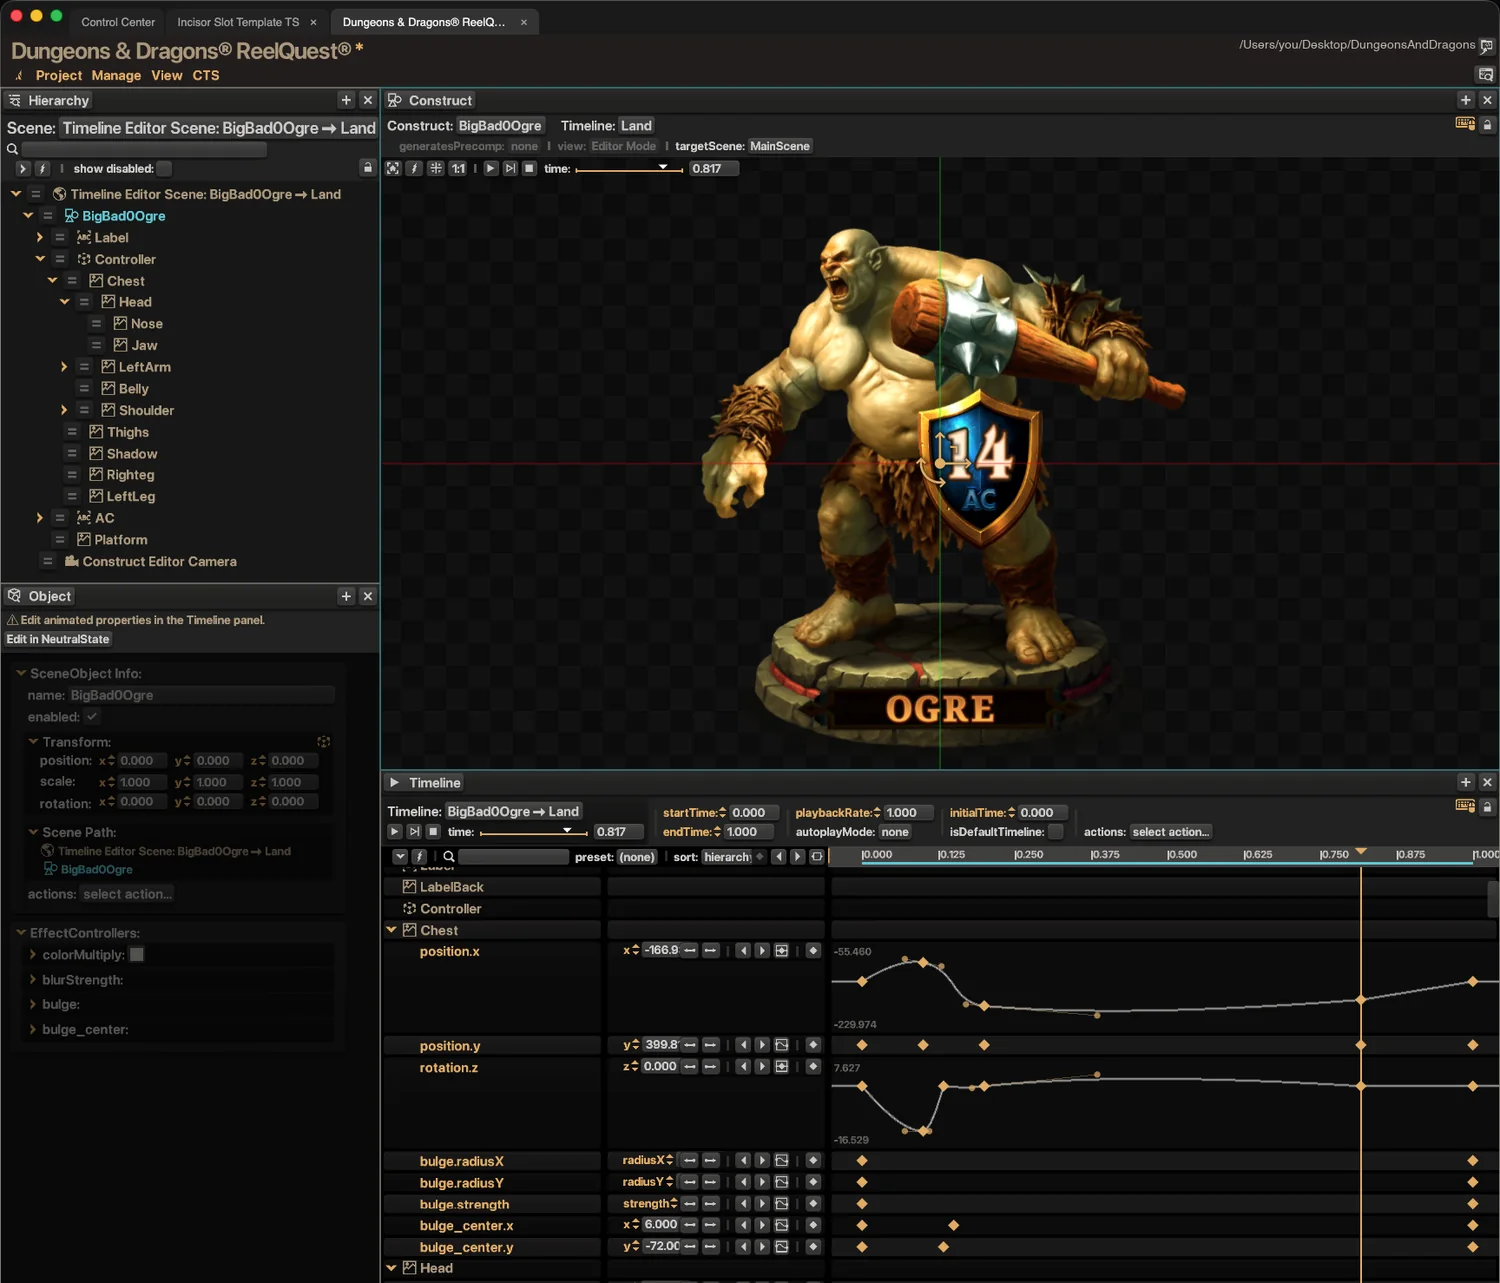
Constructs and Timelines, expanded
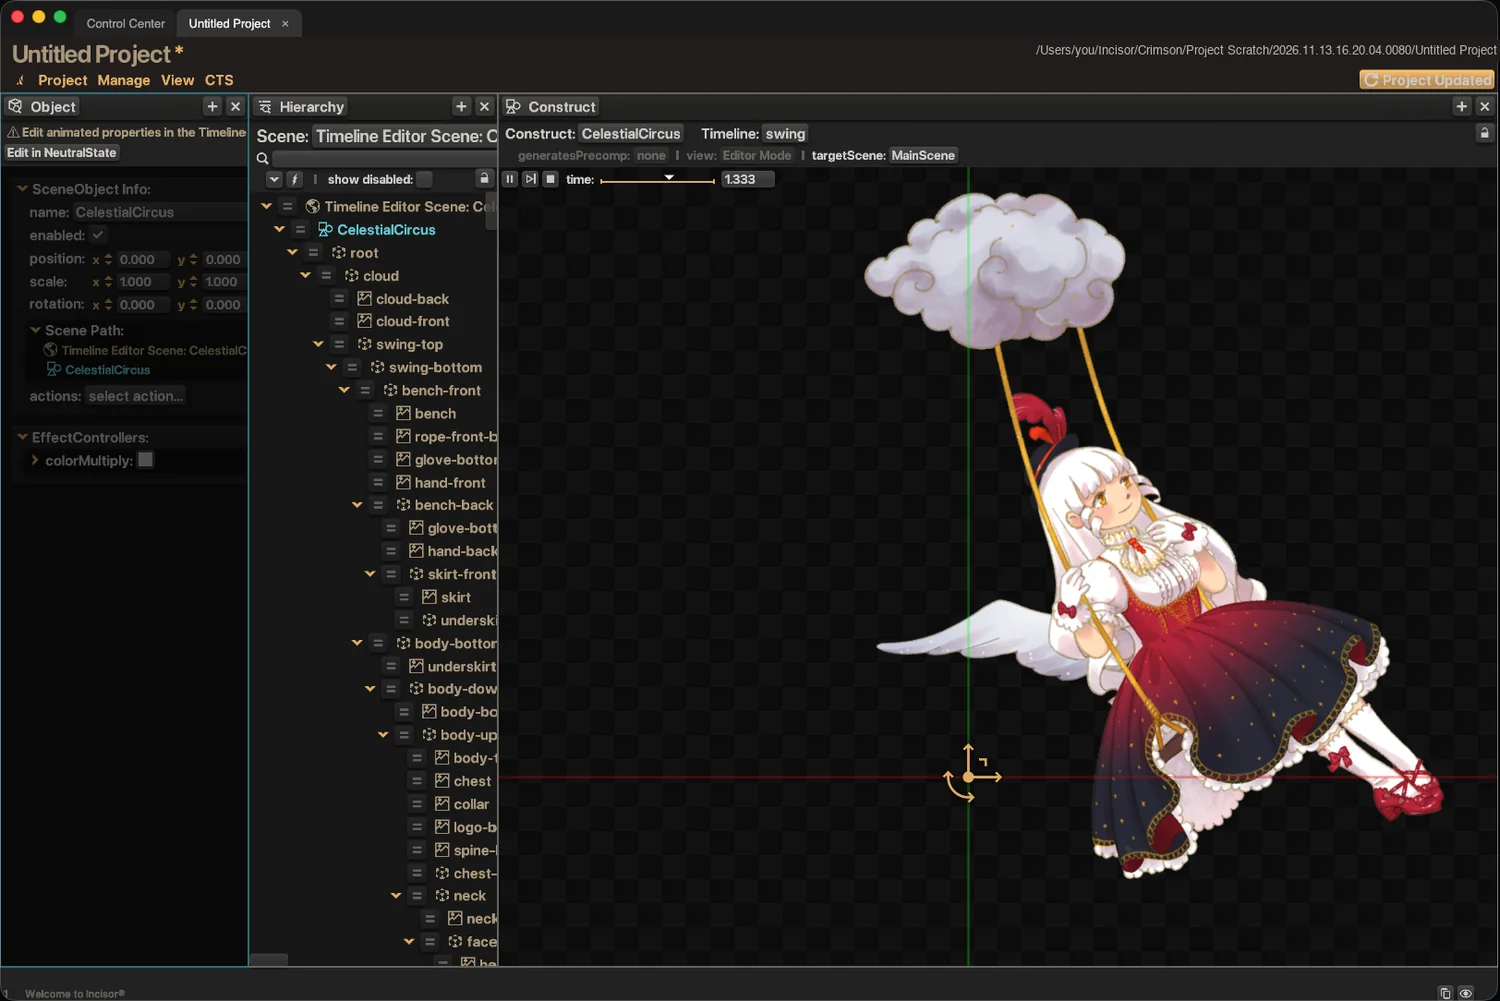
Timelines animate far more than position and scale now. Keyframe text, layers and blend modes. Trigger sounds and events straight from the timeline. And a new keyframe GUI makes every keyframe something you can see and grab.
Sequencing a game with FlowControllersThe new Symbol Reel
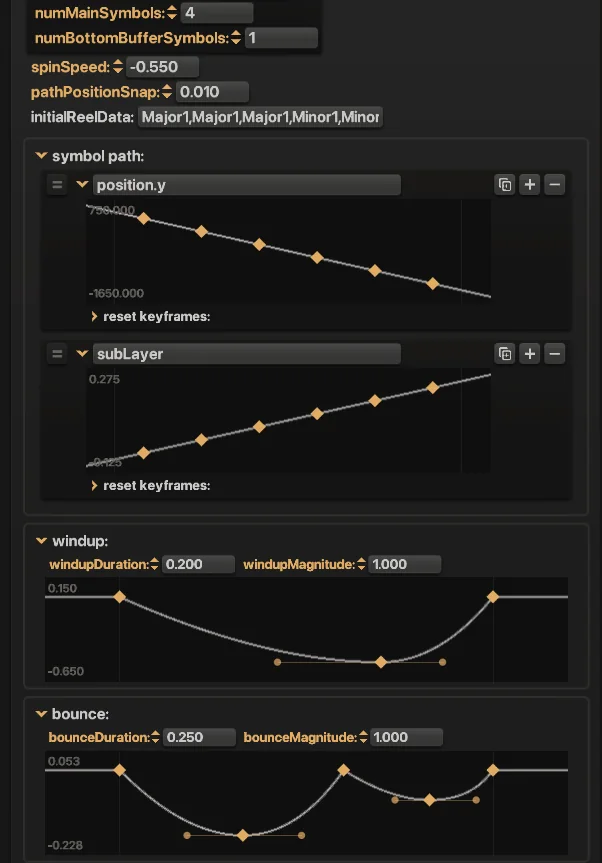
A reel is now an object with a visual editor. Draw the symbol path, shape the windup and the bounce as curves, and expand what a symbol can be. The spin on the left is the Symbol Reel at work.
Project Data and the Data panel
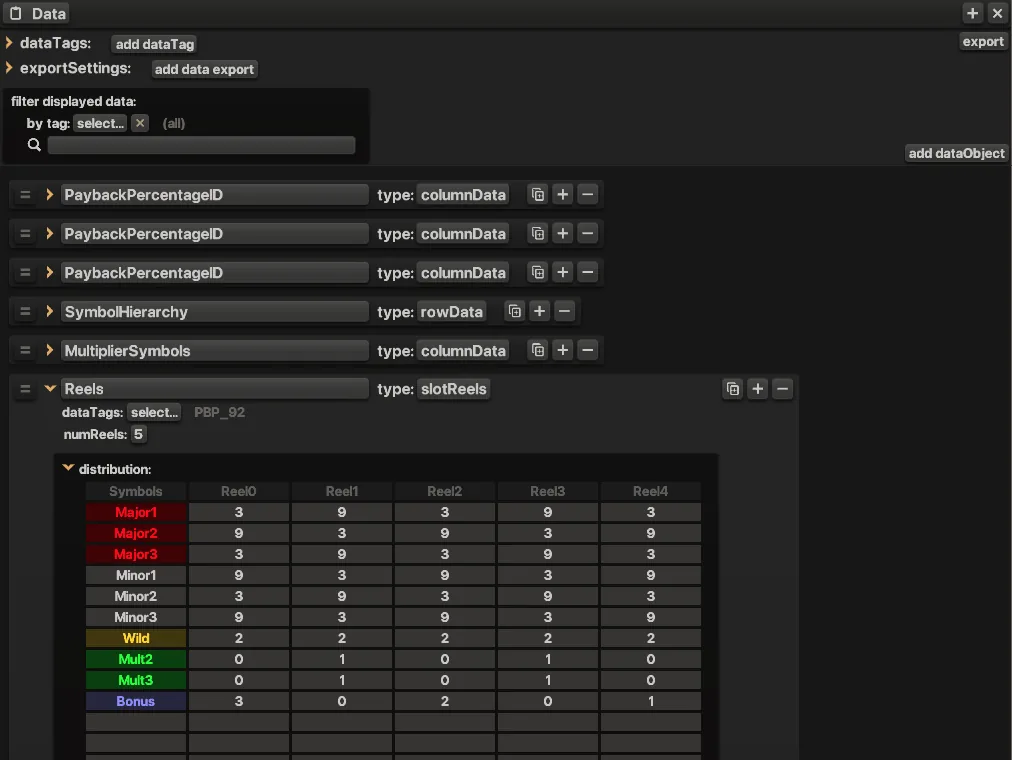
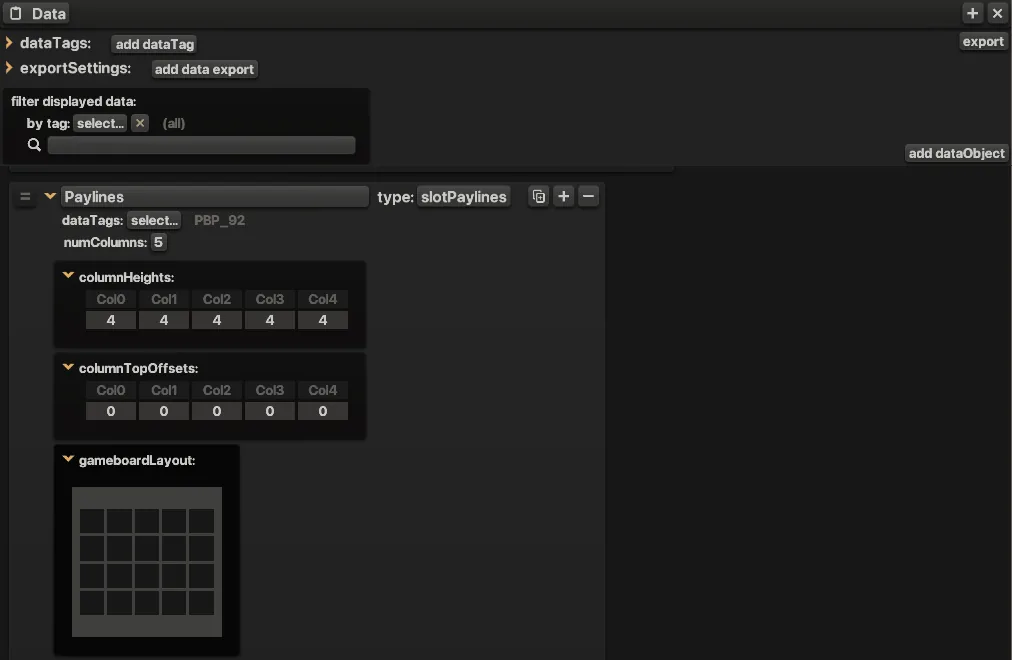
Game data can now be built in your Incisor® project, with a form for each kind: generic tables, plus purpose-built editors for paylines, reels and weighted tables. Tag a data set, and export it as a typed class your code can use.
Loading Tiers panel
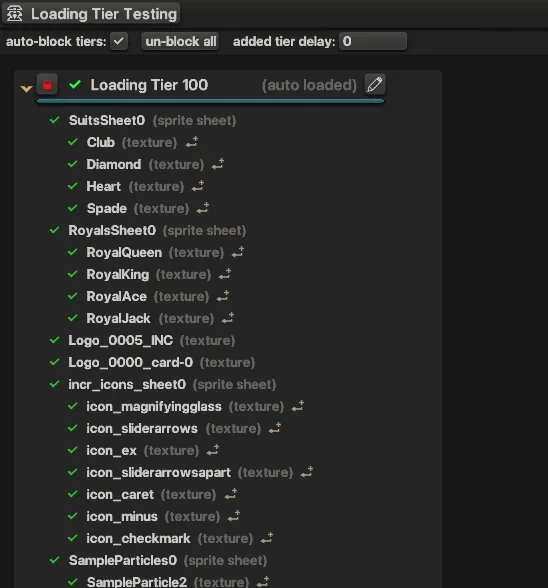
Watch every tier and every asset load, in order. Delay a tier or block lazy loading outright to see what your player sees on a slow connection.
Lazy loading in Incisor®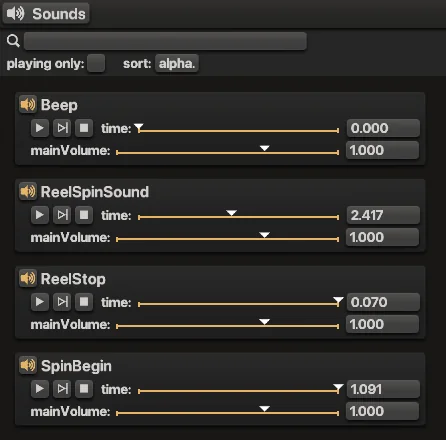
Sounds panel
Every sound in the project, with its playback position and volume live while the game runs. Nudge a volume and hear it, no code and no reload.
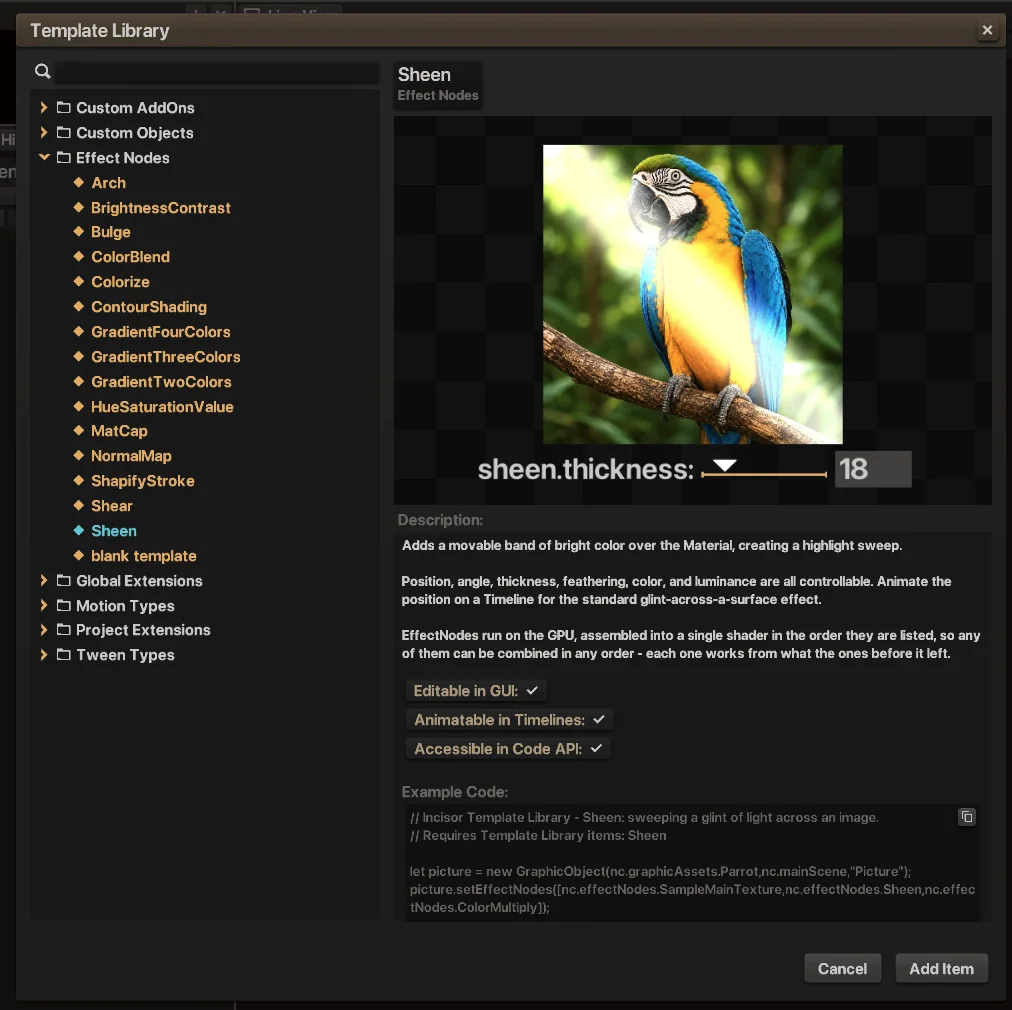
The Template Library, overhauled
Ready-made components with a description, an animated preview and runnable example code for each. They live on disk, so you can edit them and add your own.
See its text effects in Text and FontsSpine, fully.
A rebuilt importer for nearly all of Spine 4.3.
Meshes, constraints, skins and live physics simulation come across as your animator built them, and the physics keeps running in the game.
- Full current Spine spec, imported in one step.
- Runtime physics: hair, cloth and tails react to movement in play, not just in Spine.
- Skins switch at runtime.
Incisor® speaks AI.
Your assistant can know Incisor® as well as you do, and in Crimson it can drive Incisor® too.
Public MCP server
Point any MCP-capable assistant at https://mcp.incisordev.com/mcp and it can search the Incisor® knowledge base while it writes your code.
VS Code plugins
Plugins for Claude and ChatGPT set the connection up for you, inside the editor you already use.
Knowledge Base, shipped
The raw Knowledge Base comes with Incisor®, so an offline or private assistant always matches the version you're running.
The Incisor® command line
Open projects, publish, take screenshots of the project or the whole inspector, and run scripts inside a running project, all from a terminal. That's enough for an AI agent to run your game, look at it, click through it and check the result, which is exactly what it's doing here.
Controlling Incisor® from the command lineHow can I have AI test my project?
The Incisor® Knowledge Base
Nearly all of it. Free.
Everything on this page is in Incisor® Free: the app, the editor, the Project Gallery, Spine, desktop publishing and the AI tools. Free has daily usage limits instead of a feature list with holes in it.
The real toolset, not a trial.
Download Incisor®, sign in, and build with the same editor and engine professional teams use. No trial clock, no credit card, no cut-down feature set.
- Every panel, every gallery project, TypeScript, debugging, the command line and the MCP server.
- Publish to the web and the desktop from the same project.
- Daily usage limits are the only meter. Close the lid, come back tomorrow, keep building.
What Free holds back
TTF and OTF fonts are limited to the ASCII range, a few optimization tools are reserved for paid plans, published projects show the Incisor® splash screen, and Free can't be used for real-money wagering software.
Incisor® Pro
Lifts the daily usage limits, removes the splash screen, unlocks the rest of the toolset and works offline for up to four days. Upgrade from inside Incisor® whenever you're ready.
Ready when you are.
Fully backward compatible.
Your existing projects open and run in Crimson as they are. Download it, open a project from the gallery, and press Run.
More to read. New articles on the Crimson panels are on the way. For now, start with Debugging from your code editor, Controlling Incisor® from the command line and Text and Fonts, or browse every feature.